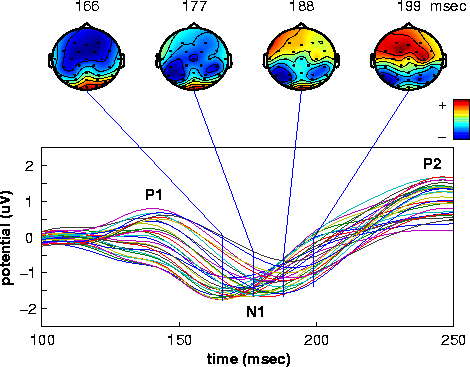
Figure 2a.
The grand mean response for all 20 nontarget conditions and 20
subjects. Responses at all 29 scalp channels are shown on the same
baseline. Note that N1 component peak latency differs at each electrode
site. The scalp maps illustrate the continuously shifting potential
distribution through the N1 peak. The maps have been scaled
individually to their minimum and maximum values to highlight shifts in
the scalp distribution of the response.
Next