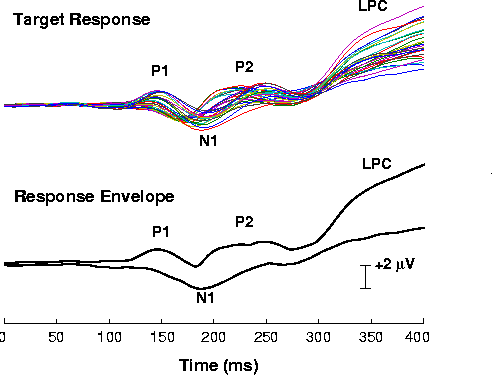

The upper (colored) traces show the grand mean target response
averaged across all 20 subjects and 5 target conditions at the 29 scalp
channels. The time series defined by the most positive and most
negative potential values across all channels at each time point may be
termed the 'envelope' of the response, as shown in the lower panel
(black traces). Conventional peak labels are shown.
Next